The Unorthodox Guide to Math Coaching

What do you notice? What do you wonder?

Screen Shot 2017-10-27 at 1.09.21 PM

I noticed that I scheduled two events for the exact same time. I wonder if I am ever going to stop over-extending myself and learn how to just say, “no. I am sorry. I cannot do that.” My inability to set boundaries comes from a good place. I want, so badly, to be in as many classrooms, working with as many teachers and students, as I possibly can.  That is great. However, when I overcommit myself, I inevitably end up letting someone down. That is not great. It is not good. It is something I want to change.

First thing Tuesday morning, I canceled my co-planning time with a 6th grade teacher so I could meet with Deb, the Math Interventionist at one of our elementary schools. The 6th grade math teacher didn’t mind. We meet often.  Our next scheduled time was on Wednesday.

Next, I drove out to Mount Vernon Elementary School to tell Deb that I couldn’t make our pre-planning session later that morning because I was scheduled to teach a 7th grade math lesson at the same time. Deb and I just started working with Katie, a kindergarten teacher.  Deb and Katie have taught and planned together a few times.  I have worked extensively with Deb over the years.  Katie and I have a good relationship. Tuesday morning was the first of many monthly planning meetings that we had set up to plan and teach together.

As soon as I told Deb I couldn’t make it to the planning meeting, I noticed she looked totally overwhelmed.  I wondered,  what the hell is wrong with me? Why do I keep over scheduling myself. It is not helpful at all.  I said what I usually say, “It is going to be okay. I have a really good plan.”

Deb, being the amazingly patient, understanding, and trusting colleague that she is, actually listened to the “big plan” I created for her and Katie.

10/24/17 PRE PLANNING MEETING

  • Watch the the Counting Collections video.  15 minutes
  • What do you notice?  What do you wonder?  10 minutes
  • Next steps: 10 minutes
    • What parts of the routine you saw in the video would you want to try to incorporate into your classroom?
    • How do we do that?
  • Read plan for today
  • Look at and discuss the counting and cardinality progress monitoring sheet.
  • If there is time, you can try to use it with some of the kids from the video.

Deb looked a little less uneasy. I asked her, “what do you think?” She said, “I love this. I think I can do this. I just needed you to talk me through it. I panicked when you said you weren’t go to be here.”

Of course she panicked. Why wouldn’t she?  I told her I was going to be here.  Believe it or not, I have actually read books about math coaching. I have gone to conferences and taken classes about how to be a good math coach.  All of these experiences taught me that keeping commitments is essential to being a good math coach. I almost convinced myself that I made up for having to cancel the preplanning meeting by meeting with Deb to go over the preplanning meeting. Then, I reminded myself that Deb could have been doing something else instead of meeting with me from 7:30 – 8:30.  She could have been meeting with kids or teachers.

I left Deb and headed to the middle school to teach a 7th grade math lesson.  I had met with this team of teachers last week and they were struggling to find good lessons for their students. They have a small group of multi-aged students who have some “holes” from prior years. They told me they are struggling to use our district curriculum because the 6th, 7th, and 8th grade standards are “beyond what their students can do right now.”  I was thrilled when they asked to meet with me. They were reflective and asked for help.  I asked if I could come in and teach a lesson so they could observe their students. Then, we could talk about what they noticed.

I chose to do lesson 1 from unit 1 of Open Up Resource’s Illustrative Mathematics  Middle School Math Curriculum because I knew the students were going to start their unit on scale soon and it is one of my favorite lessons to teach.  I also knew they would love the interactive apps that are part of the lesson.

I thought the lesson went great. Some kids got frustrated and shut down, but they came back.  Kids were talking over me most of the time, but it was always about math. Some kids were totally playing with the GeoGebra app instead of drawing scaled versions of the letter F, but that was my bad. I didn’t take 3 minutes to just let them play with the app before I started the activity.  Oh, and they were “playing with math” so who cares? Every kid matched up the pairs of scaled figures correctly and most made mistakes while they were doing it or had to justify their reasoning because their partner made a mistake.

After the lesson, the teachers and I talked. They said,

  • “I can’t believe _______ and ______ volunteered to share their thinking.”
  • “How about ______? He really struggles with math and usually doesn’t talk. “
  • “How cool was it when________ shared________?”

I was so psyched and proud that these comments were all about what the kids knew and could do.  My favorite part was when one of the kids who they said really struggled in math handed in his exit slip:

Screen Shot 2017-10-27 at 2.44.54 PM.png

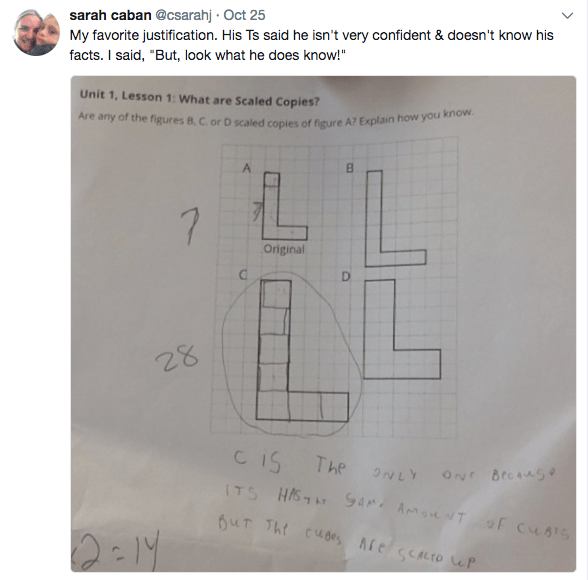
After his teachers commented that he didn’t know his multiplication facts, I said, “Yeah, but he reasons multiplicatively! It is so much “easier” to teach a kid like this to learn his facts, then it is to teach a kid who memorized a bunch of facts how to reason multiplicatively.”  At this point in the conversation, I panicked.

“Oh my god,” I said.  “What time is it?”

“11:00”

“Phew. I have to go teach Kindergarten in Mount Vernon. Can I come back?”

“Anytime. That was awesome. We would love to get our kids to talk more.  I loved how you taught that lesson, but if I tried to teach like you, they would just tell me I was trying to act like Mrs. Caban.”

“What do you mean?”

“I love how you kept saying, ‘say more’ and ‘how do you know?'”

At this point, one of her colleagues spoke up.  She said, “You say some of those things. I hear you ask kids to explain their thinking. You just might say it differently.”

They thanked me again and asked me to come back anytime. I asked them if I could email them to set up a time where we could meet to plan. They said, ” You are welcome anytime. It was really cool to see our kids learn today.”

I got in my car and it wasn’t until I was halfway to Mt. Vernon that I realized I forgot my bags of shapes for counting collections routine. I wish I could say that doesn’t happen to me all the time, but I can’t. I forget things a lot. So, I drove back to the middle school, picked up my shapes and headed to Mount Vernon.

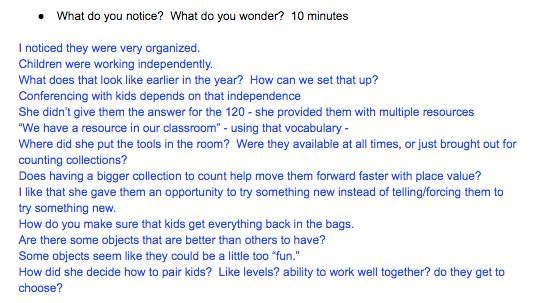
When I arrived at Mount Vernon, Deb shared how the pre-planning session went.  She said it went great. She and Katie spent most of the time reflecting. Check out some of their responses:

Screen Shot 2017-10-27 at 2.14.07 PM.png

Screen Shot 2017-10-27 at 2.14.57 PM

Now, it was time to teach Kindergarten.  I am absolutely terrified of teaching Kindergarten.  My wheelhouse is grades 3-8.  Deb and Katie knew that I was scared and they agreed to carry on the lesson if I ended up in the fetal position under a table.

I started the Kindergarten lesson by sharing a few questions that I have been wondering about lately:

  • What makes counting hard?
  • How can we make it easier?

I wish I had a picture of the posters we created. They had some really thoughtful answers to my questions. I will ask Deb to take a picture and I will add it to the post later.

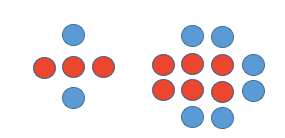
We started the lesson by noticing and wondering about berries (Thanks Number Talk Images):

Screen Shot 2017-10-27 at 3.00.01 PM

Then, I modeled how I would count my collection of tiling turtles (thanks Christopher Danielson)

Screen Shot 2017-10-27 at 3.02.32 PM.png

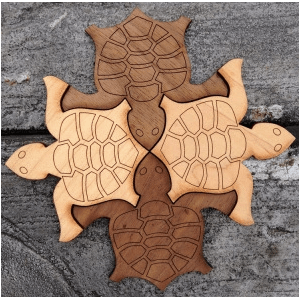
I thought out loud while I counted my turtles. I counted really fast and I did not touch a turtle every time I said a number. I think I counted 39 turtles.  Before I could finish counting, at least three indignant 5 year olds interrupted me:

  • “You’re not doing it right!”
  • “You said too many.”
  • “You’re going to fast!”

I asked them for some advice.  They told me to move the turtles and make sure I touch each one. So, I did. I wish I had a voice recording of the next part because it sounded beautiful.

I started counting more rhythmically, intuitively aligning the cadence of my voice with the slide of my finger:

“one” (sliiiide)

“two” (sliiide)

Right about here, I think, is where a few students started counting with me. I didn’t ask them to. They just did. By the time I got to 5, we were counting together. Then, I started to play.

I slid the sixth turtle reallllllllly slowly and I didn’t say anything. I heard a cacophony of this:

“Siiiiiiiiiiiiiiiiix”

“six, sev- (pause) six”

“six, seven,”

I kept going. I alternated between speeding up my turtle slide and slowing it back down. I even paused a couple of times. Most of the kids kept the cadence of the count. A few didn’t. Deb noticed it and she intentionally observed those students during the collection count.

After we established that I had 19 tiling turtles, I said, “hmmmm. I would like to record my thinking so Mrs. Reed can see it later.” I wrote 19 on my recording sheet.

Then I continued, “It says that I should show how I counted.”  I started drawing a turtle. “This is going to take me awhile. I don’t really want to draw all 19 turtles. I wonder if there is another way I can show how I counted.”

One girl spoke up right away. She said, “You just have to draw 2 turtles. Draw a 1 in that turtle and a 9 in the other turtle. Then, you have 19.”

I did what she said. Inside, I started to squirm.  “Okay. Does anyone have any other ideas?”

“You could draw a person with a long arm and then draw a turtle in the hand.”

I said, “I could do that.” I thought, where is the nearest table to crawl under?  I asked, “Is there anything else I could do?”

“You could draw a speech bubble that says ’19′”

“You could draw unicorns!”

“I could draw unicorns. That seems like it might be harder than turtles.”  Mrs. Hatt and Mrs Reed were smiling at me. I was sending subliminal cries for help.

“You could draw horses!”

“Unicorns can turn into turtles.”

I said, “that is true.”  Seriously. That is how I responded to the comment about unicorns turning into turtles. I said, “that is true.” I didn’t even realize I said it. I was looking for the nearest table. Deb told me after the lesson. Apparently, she wrote it in her notes.

I was stuck. None of these children were telling me anything that I had hoped I would hear. So, I asked again, probably louder and slower this time,  “I wonder how I could show my thinking without drawing all of the turtles.”

The five-year olds wiggled and squirmed. We had been sitting for what felt like at least three days. There was no more criss-cross-apple-saucing. Nobody’s hands were in their cookie jar anymore.

Out of nowhere, I heard “We could use tally marks.”

“YES! YES WE CAN,” I said in my not-so-neutral voice. “We can definitely use tally marks!” I drew 19 tally marks and decided to move on.  Deb, Katie, and I had talked previously about how we don’t want to force tally marks, circles, or ten frames on kids as a recording strategy.  It is October. We have plenty of time to let recording strategies evolve. We agreed that if it came up, we would highlight it, but we didn’t want to force it. I highlighted the bejeezus out of it.

I asked, “Who wants to help me count my shape collection?”

A resounding, “me!”

Phew.  I handed each child a bag of shapes and a recording sheet.  They scattered.

Deb, Katie and I circulated and conferenced. I intentionally gave the students more than twenty objects. I was hoping for the counting to be hard. I was hoping they would have to count their collection multiple times.  I was hoping to challenge them. The truth is I don’t know how to “teach” 5 year olds how to record their thinking.  All I know is that Deb, Katie, and I are all really interested in figuring it out together. Here is some of the work we collected from the lesson.

This slideshow requires JavaScript.

We plan to go over the work and talk about next steps at our next meeting, which is November 7th.  In the meantime, I had an awesome email exchange with Deb and Katie.  It went like this:

Screen Shot 2017-10-27 at 3.40.29 PM

Screen Shot 2017-10-27 at 3.41.48 PM

Screen Shot 2017-10-27 at 3.43.52 PM

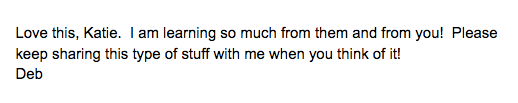
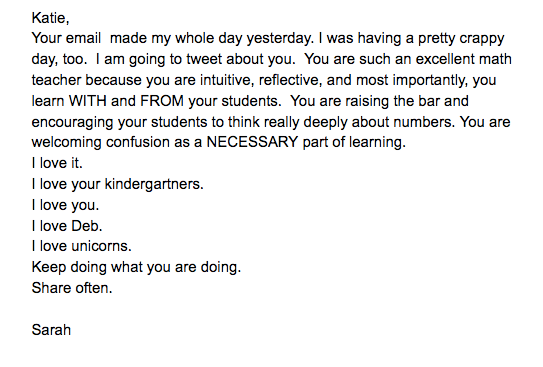
Yup. It’s true. I told Katie I love her. In fact, I tell teachers I love them all the time. Sometimes, I hug people, without asking first. Today, I spontaneously told a student I love her. Yikes. Not the kind of behavior you read about in math coaching books. I am not your typical math coach. I really struggle with:

  • being on time
  • finishing what I start
  • filtering my emotions
  • listening without interrupting
  • overcommiting myself
  • drying my hair before I go to work
  • wearing my name badge
  • keeping track of my belongings
  • blurting out ideas

BUT

Here is what I do really well:

  • build relationships
  • advocate for kids
  • take risks
  • share my mistakes
  • ask questions
  • pay attention to the positive
  • think big
  • think mathematically
  • love, love, love my job
  • learn
  • try to be a better math coach


Culture

I just started taking the last of my classes to obtain a Certificate in Math Leadership. The name of the class is The Art of Math Coaching and Supervision. I was offered the opportunity to “design” the course so I had some ownership over the work I did. I asked if I could use my blog as a platform for reflection, instead of writing papers.  The six blog posts are supposed to “Set the Stage – Describe relationships I have as a K-12 math leader to advance student performance in mathematics.” 

The first blog post I wrote, Limits, was about me being vulnerable.  I set the stage. I peeled back layer after layer of the shame and frustration that has accumulated over the 20 years of my formal math instruction and exposed the mathematician in me. The mathematician who didn’t know the answer, but wanted to. I thought the message was obvious; being a math coach means admitting what you don’t know.

My professors thought the blog post was written by one of the teachers that I work with. They said she showed a lot of reflection.  They said my blog posts fulfilled some of the “setting the stage” assignment, but they asked me to write a 1-2 page paper describing my professional relationships with other people in my district.  They said the 1-2 page paper would show “how math coaches/specialists become a part of the school culture.”

I can’t help but wonder, why didn’t they think I wrote that blog post?

I hope I have supported the teachers I work with to admit what they don’t know and  learn a tremendous amount with me and that is the culture that I hope to cultivate in math class.


Rife With Conflict

For the past five years, every February, I have presented data to the school board. The purpose of these presentations was to use “data” to convince the school board that my job, and the job of the math interventionists in our district, mattered. I would show them all kinds of colorful charts in the hopes that they would “see” us making a difference.

“Look!” I would say. “All these kids went from red to green!  Isn’t that amazing?! We matter!  We are doing a good job!  Right?”

Screen Shot 2017-10-22 at 7.10.36 AM.png

Most of the time, the school board was thrilled with my colored charts. “Yay, Sarah! Look at all that progress.”  Last February, one school board member, I will call him Mr. G,  had a different reaction. He wanted to talk about the kid in the bottom row:

Screen Shot 2017-10-22 at 7.20.39 AM

He said, “I am looking at these three words, ‘did not improve’ and I am thinking that tells me that you didn’t do your job.”

How would you have responded to this comment? What would you have said?

Honestly, I don’t even remember what I said. I probably said something like, “there are so many factors that impact student learning,” or maybe even “well, we shoot for 80 percent of students to meet grade level standards and look at all the students that did improve, look at all that green, blah, blah, blah, blah…..”

I left that board meeting fuming mad.  I heard those words every second of every day for weeks.

You are not doing your job.

So many people told me to forget about that comment. They said, “he doesn’t know what he is talking about” ,”he is grumpy,” “he never has anything positive to say”, “you are doing a great job” “the interventionists are doing a great job”.

Those words rattled around in my brain for months. At some point, I reframed them as  a question,

Am I doing my job?

My reflections became more transparent with every day that passed.  I began to realize that I had created a monster, a data monster.  I had conditioned the school board to expect colorful charts. Every year, my main focus was getting one more math interventionist position into the budget.  What was the quickest way to show the board we needed one?  Data.

The tricky thing about data is that I can pretty much make it say whatever I want it to.  A few years back, we had a math interventionist who was only able to visit one of our elementary schools once a week. Come February, I made a bunch of colorful charts to show the board that the kids she saw on that one day weren’t making progress, but the kids she saw 4 days a week at her other school were making progress.  The data I showed the board was real. It was based on screeners, common assessments, NWEAs, etc.  I didn’t manipulate the data. I manipulated the story.

What was the story I was telling the board? It was a story about how the math interventionists job was to “fix kids”.  I was showing the board a bunch of numbers and colors. I wasn’t showing them kids, teachers, and math classrooms. It makes total sense that Mr. G didn’t think any of us were doing our jobs.  I had been spending years “showing” the board that our job was to “fix” kids.  The worst part about the story I was telling is that it wasn’t true. If you follow me on twitter or have read even one of my other blog posts, you will know that I am not in the business of “fixing” kids.  I hope you will also know that I am not in the business of “fixing” teachers. So what happened?  How did the story I was telling become so far removed from the story I was living?

I think the gap was born out of simplicity, efficiency, and trust. I thought I needed to “sell” the board a quick and easy need for more math support positions.  I didn’t trust that they would understand the uncomfortable truth of working with kids and teachers. The truth? We have been trying to collaborate, but collaboration is messy, uncomfortable, and rife with conflict.

This year, I decided to change the story I was telling. I asked if my first presentation could be early in the year. Last Wednesday, I started to tell a different story. A story that matched the truth about the work the math interventionists and I have been trying to accomplish.

We, as a math support team, have been trying  to collaborate; with each other, teachers, parents, administrators, and studentsLast spring, we created a vision statement:

Screen Shot 2017-10-22 at 12.53.38 PM

Screen Shot 2017-10-22 at 8.04.00 AM

Then, we started to draft a document that defines what math class should look like. Many of us had read Minds on Mathematics by Wendy Ward Hoffer. We used this book as an anchor when we defined the essential elements of a math class: Challenging Tasks, Collaborative Community, Intentional Discourse, Conferencing, and Reflection.  Below is a screenshot from this document. Keep in mind, it is a DRAFT.  We didn’t create this work in a vacuum. As a district, certain buildings and groups had done some important work in the past that is reflected in the chart we created. Some elementary schools had done learning rounds on the Common Core Math Student Practices and the NCTM Teaching Practices.  The elementary and middle school teachers had spent time trying to answer the question, “what is a workshop model?” I have facilitated learning labs at the K-8 level during grade level meetings for two years.

Screen Shot 2017-10-22 at 8.06.26 AM

As a team, the interventionists and I started the year with an agreement that all math interventions would start with, and be anchored to, classroom instruction.  We re-defined the “data” we wanted to collect.  Yes, we are still going to look at data from universal screeners and common assessments, but what else are we going to look at?  How are we going to know if collaboration is making  a difference?  How are we going to know if we are doing our jobs?

We each created an excel spreadsheet that we will all use to collect “data”.  The first page looks like this:

Screen Shot 2017-10-22 at 8.23.35 AM

Yes, it also has a bunch of test scores on it. There are many columns to the right of the ones you see above.  The columns you see above are the most important. The second page of the document looks like this:

Screen Shot 2017-10-22 at 8.30.04 AM

Recently, we have noticed a glaring problem:

Screen Shot 2017-10-22 at 8.37.21 AM

We never established goals and norms with some of the teachers we are collaborating with.  We didn’t think we “had” to.  Some of us have worked together in the past.  We knew each other well.  We had established relationships with these teachers.  We never sat down and formally articulated norms and goals.  We made assumptions.  This was a bad idea.

Right now, some of us are feeling uncomfortable and frustrated.

  • “I feel judged.”
  • “I just want you to pick up my kids and work with them outside of my classroom.”
  • “I don’t want you to see my kids. I will just work with them myself.”
  • “There are too many adults in my room.”
  • “I am doing all the planning. How do I get the teachers to work with me?”
  • “How are we supposed to schedule this? I don’t have time to wait for a mini-lesson to end.”
  • “I just need a break. I have 26 kids and I feel like I don’t even know them, yet. I have to share them with too many people. I just want two weeks with my students, just me and my students.”

All of these statements are true.  All of them are valid. We are at one of many pivotal points in our journey.   We are at a point where we can give up or reflect, revise, and move forward.

Even though we feel frustrated and uncomfortable, there are some wonderful things happening in our math classrooms.  Did you see that collaborative planning doc above?  It is awesome!  Teachers and interventionists are meeting regularly to plan and teach children together.  We are all trying to improve our craft. We are trying to do this work together.  At my board presentation, I shared an example of this collaborative work.  You can see it here.  I also shared the struggles we are having.

We are all feeling incredibly vulnerable.  This is good!  Vulnerability is at the heart of true collaboration.  However, feeling vulnerable is scary.  We might need to back up; maybe slow down, ask for help, and be courageously honest. Collaboration is messy, uncomfortable, and rife with conflict, but it is essential for equitable and effective math support.

Save the Least Efficient Strategy for Last

Recently, I have been thinking a lot about the 5 Practice for Orchestrating Productive Mathematics Discussions by Margaret S. Smith and  Mary Kay Stein.  In particular, I have been thinking about sequencing.  Often, I hear people say that we should sequence student work from the least efficient strategy to the most efficient strategy.  I agree that there are times that we might want to sequence work from least efficient to most efficient, but I think we should be intentional about when and why we chose those times. I also wonder about the times that it might be more useful to save the least efficient strategy for last.

Look at the image below and write down one thing you notice and one thing you wonder:

Screen Shot 2017-10-14 at 9.52.11 AM

When I asked a group of 6-12 teachers what they noticed, they said:

  • “I notice missing dots in all the corners.”
  • “I notice each image has a middle part and then dots surrounding the middle part.
  • “The middle part is a square in three of the images.”
  • “I notice the number of the dots on the outside sections increase by one each time.”
  • “I notice that the number of the dots on the top and sides tells you how many rows and columns there will be.”
  • “I notice the number of rows and columns increases by one each time. So the step number tells you how many rows of three dots you need
  • “I notice a pattern. It goes (1×1)+(1×4), (2×2)+(2×4), (3×3)+(3×4), (4×4)+(4×4).”
  • “I notice little white squares in between the block dots.”

Then, I asked them what they wonder.  They said,:

  • “I wonder what the hundredth one would look like?”
  • “I wonder what the one before the first one would look like?”
  • “I wonder what the next one would look like?”

Perfect timing. I showed them this slide:

Screen Shot 2017-10-14 at 10.01.43 AM

They all went to work.  As they worked, I monitored.  I had anticipated that, in a room full of 6-12 educators, several people would see the following expressions in the dots:

Screen Shot 2017-10-14 at 10.17.29 AM.png

The original version of this Illustrative Mathematics task actually gives these two expressions:

Screen Shot 2017-10-15 at 6.31.25 AM

I decided to remove the text from this task because I was hoping  to lower the floor and raise the ceiling. My goals were to get us  thinking more deeply about equivalency and the language of math. How do we use symbols to convey relationships that we see in images?  How does the structure of an expression help us represent what patterns and relationships we see? How do we know that we truly understand what another person sees and thinks? Often, I wonder if we assume we know what our students are thinking when, in fact, we are merely projecting our own thinking onto their words.

So, with those goals in mind, I set out trying to find:

Someone who quickly pulled the following expression out of the images:

Screen Shot 2017-10-14 at 10.17.17 AM

I was thinking that this is one of the more efficient expressions for finding the total number of dots in any step.  One person had already eluded to it during our notice and wonder phase. I planned on sharing it first because I wanted to use it as an anchor for equivelance.  I also wanted us to look beyond efficiency.  I wanted us to wonder if there were times when a long clunky expression with many terms might serve a purpose. Maybe? Maybe not? I didn’t know the answer, but I wanted to explore the question.

So, our first friend, Lily shared where she saw Screen Shot 2017-10-14 at 10.17.17 AM.

When Lily finished, I asked Rita, “What do you notice about the pattern you noticed earlier and the expression that Lily just shared?”

Screen Shot 2017-10-15 at 5.08.30 PM

(1×1)+(1×4)        (2×2)+(2×4)          (3×3)+(3×4)           (4×4)+(4×4)

She said “Oh. Well they are equivalent. You can see the Screen Shot 2017-10-15 at 6.54.26 AM in the first term of my expression and you can see the Screen Shot 2017-10-15 at 6.54.37 AM in the second term in my expression.”

“What does n represent in the image?”

“It is the number of dots in the bottom row.”

I asked, Lily, “Is that what n represents in your expression?”

“No. n is the step number, but it doesn’t matter because the step number is equal to the number of dots in the first row.”

Next, I asked Chris to share. When I first checked in with Chris he told me, “I am thinking about the way that Jared saw the sequence when we noticed and wondered. It sounded like he saw the three horizontal dots in the first image as the constant. I am trying to create an expression that matches his description of the pattern.”

Chris explained to the group that the expression he created was a little clunky, but he was trying to capture what Jared saw staying the same and changing.

3n + n (n+1)

Chris explained that he heard Jared referring to the three horizontal dots as the constant.

Screen Shot 2017-10-15 at 3.51.51 PM

Then, he noticed that the stage number told us how many rows of the constant we needed. The term 3n represented the array formed by n number of 3 rows.

Screen Shot 2017-10-15 at 3.53.51 PM.png

Then, he had some extraneous rows and columns that he needed account for.  He realized that there were always n+1 groups of n dots.

Screen Shot 2017-10-15 at 3.58.26 PM

So, he came up with the expression: 3n + n (n+1).  He asked Jared, “Is this how you were seeing it?” Jared said, “yes.”

Then I asked, is 3n + n (n+1) equivalent to Screen Shot 2017-10-14 at 10.17.17 AM?

Everyone agreed.  Someone shared that they could “see” it. “If you distribute the n, you have n squared plus n. Then, you just add the n to 3n and you have n squared plus 4n.”

Next, I asked two people to come up to the document camera, Rachael and Max. Earlier, when I was monitoring, I found Rachael describing how she saw the pattern changing and staying the same.  She said, “I can see a relationship, but I can’t find an expression to represent my thinking.”  Max asked her to describe the relationship she saw. She said, “I can move one of the dots from the top row down to the lower left corner to make a square and then just add the dots that are on the border.” Max suggested the expression  Screen Shot 2017-10-15 at 4.04.22 PM 
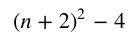
and described how he saw it in the dots:

Screen Shot 2017-10-15 at 4.07.55 PM

Rachael said, “I see where your expression is in the dots, but your expression doesn’t represent what I was seeing.”

Max and I were determined to find the expression that matched Rachael’s thinking.  We tried to rephrase what we thought she was saying.  We marked up the picture as we spoke:

Screen Shot 2017-10-15 at 4.10.18 PM.png

She said, “Yes! That is how I see it.”

After some false starts, questions, and dead ends, we figured it out!

Screen Shot 2017-10-15 at 4.18.39 PM

We decided n would represent the number of dots in the top row, which is also the step number. I asked Max and Caitlin to share our experience and speak to how they knew their expression was equivalent to the others. They said they were able to prove equivalence algebraically.  They shared their work.

As I sit here now, I am realizing that I can “see” the structure of Caitlin’s expression in the image. I don’t think I need to verify equivalence algebraically.  I think all the dots are accounted for.  Each term represents a group of dots.  n-1 represents the top row of dots. n+1 squared represents the lower left corner of dots (arranged as a square). Is the “action” of the dot moving represented by the subtraction symbol or is the subtraction symbol really a negative sign? I still have so many questions.  The final n represents the column of dots all the way to the right.

I wish I could say that I had made this connection during my session with the 6-12 teachers, but I didn’t. At the time, I was primarily focussed on creating a situation where a group of educators would share their thinking, listen for understanding, and change their perspectives, which is why I saved the least efficient strategy for last.