

Recently, I have been thinking a lot about the 5 Practice for Orchestrating Productive Mathematics Discussions by Margaret S. Smith and Mary Kay Stein. In particular, I have been thinking about sequencing. Often, I hear people say that we should sequence student work from the least efficient strategy to the most efficient strategy. I agree that there are times that we might want to sequence work from least efficient to most efficient, but I think we should be intentional about when and why we chose those times. I also wonder about the times that it might be more useful to save the least efficient strategy for last.
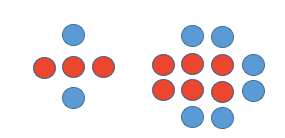
Look at the image below and write down one thing you notice and one thing you wonder:

When I asked a group of 6-12 teachers what they noticed, they said:
- “I notice missing dots in all the corners.”
- “I notice each image has a middle part and then dots surrounding the middle part.
- “The middle part is a square in three of the images.”
- “I notice the number of the dots on the outside sections increase by one each time.”
- “I notice that the number of the dots on the top and sides tells you how many rows and columns there will be.”
- “I notice the number of rows and columns increases by one each time. So the step number tells you how many rows of three dots you need
- “I notice a pattern. It goes (1×1)+(1×4), (2×2)+(2×4), (3×3)+(3×4), (4×4)+(4×4).”
- “I notice little white squares in between the block dots.”
Then, I asked them what they wonder. They said,:
- “I wonder what the hundredth one would look like?”
- “I wonder what the one before the first one would look like?”
- “I wonder what the next one would look like?”
Perfect timing. I showed them this slide:

They all went to work. As they worked, I monitored. I had anticipated that, in a room full of 6-12 educators, several people would see the following expressions in the dots:

The original version of this Illustrative Mathematics task actually gives these two expressions:

I decided to remove the text from this task because I was hoping to lower the floor and raise the ceiling. My goals were to get us thinking more deeply about equivalency and the language of math. How do we use symbols to convey relationships that we see in images? How does the structure of an expression help us represent what patterns and relationships we see? How do we know that we truly understand what another person sees and thinks? Often, I wonder if we assume we know what our students are thinking when, in fact, we are merely projecting our own thinking onto their words.
So, with those goals in mind, I set out trying to find:
Someone who quickly pulled the following expression out of the images:

I was thinking that this is one of the more efficient expressions for finding the total number of dots in any step. One person had already eluded to it during our notice and wonder phase. I planned on sharing it first because I wanted to use it as an anchor for equivelance. I also wanted us to look beyond efficiency. I wanted us to wonder if there were times when a long clunky expression with many terms might serve a purpose. Maybe? Maybe not? I didn’t know the answer, but I wanted to explore the question.
So, our first friend, Lily shared where she saw .
When Lily finished, I asked Rita, “What do you notice about the pattern you noticed earlier and the expression that Lily just shared?”

(1×1)+(1×4) (2×2)+(2×4) (3×3)+(3×4) (4×4)+(4×4)
She said “Oh. Well they are equivalent. You can see the  in the first term of my expression and you can see the
  in the second term in my expression.”
“What does n represent in the image?”
“It is the number of dots in the bottom row.”
I asked, Lily, “Is that what n represents in your expression?”
“No. n is the step number, but it doesn’t matter because the step number is equal to the number of dots in the first row.”
Next, I asked Chris to share. When I first checked in with Chris he told me, “I am thinking about the way that Jared saw the sequence when we noticed and wondered. It sounded like he saw the three horizontal dots in the first image as the constant. I am trying to create an expression that matches his description of the pattern.”
Chris explained to the group that the expression he created was a little clunky, but he was trying to capture what Jared saw staying the same and changing.
3n + n (n+1)
Chris explained that he heard Jared referring to the three horizontal dots as the constant.

Then, he noticed that the stage number told us how many rows of the constant we needed. The term 3n represented the array formed by n number of 3 rows.
Then, he had some extraneous rows and columns that he needed account for. He realized that there were always n+1 groups of n dots.

So, he came up with the expression: 3n + n (n+1). He asked Jared, “Is this how you were seeing it?” Jared said, “yes.”
Then I asked, is 3n + n (n+1) equivalent to ?
Everyone agreed. Someone shared that they could “see” it. “If you distribute the n, you have n squared plus n. Then, you just add the n to 3n and you have n squared plus 4n.”
Next, I asked two people to come up to the document camera, Rachael and Max. Earlier, when I was monitoring, I found Rachael describing how she saw the pattern changing and staying the same. She said, “I can see a relationship, but I can’t find an expression to represent my thinking.” Max asked her to describe the relationship she saw. She said, “I can move one of the dots from the top row down to the lower left corner to make a square and then just add the dots that are on the border.” Max suggested the expression 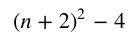 and described how he saw it in the dots:

Rachael said, “I see where your expression is in the dots, but your expression doesn’t represent what I was seeing.”
Max and I were determined to find the expression that matched Rachael’s thinking. We tried to rephrase what we thought she was saying. We marked up the picture as we spoke:

She said, “Yes! That is how I see it.”
After some false starts, questions, and dead ends, we figured it out!

We decided n would represent the number of dots in the top row, which is also the step number. I asked Max and Caitlin to share our experience and speak to how they knew their expression was equivalent to the others. They said they were able to prove equivalence algebraically. They shared their work.
As I sit here now, I am realizing that I can “see” the structure of Caitlin’s expression in the image. I don’t think I need to verify equivalence algebraically. I think all the dots are accounted for. Each term represents a group of dots. n-1 represents the top row of dots. n+1 squared represents the lower left corner of dots (arranged as a square). Is the “action” of the dot moving represented by the subtraction symbol or is the subtraction symbol really a negative sign? I still have so many questions. The final n represents the column of dots all the way to the right.
I wish I could say that I had made this connection during my session with the 6-12 teachers, but I didn’t. At the time, I was primarily focussed on creating a situation where a group of educators would share their thinking, listen for understanding, and change their perspectives, which is why I saved the least efficient strategy for last.

It seems to me here that efficiency isn’t the main thing, but a sort of agility.
The ability to see the same thing from different perspectives, some of them not your own, and clearly describe them, is like an added power. You’re giving yourself more possibilities – which ultimately links to efficiency, because even though you went from A to B through C and D rather than directly, next time you might want to get from C to B.
LikeLike